employees network Analysis
Business Case
Head of HR wants help mapping out the company's employee network using message data. They plan to use the network map to understand interdepartmental dynamics better and explore how the company shares information. The ultimate goal of this project is to think of ways to improve collaboration throughout the company.
Business Demand
- Which departments are the most/least active?
- Which employee has the most connections?.
- Identify the most influential departments and employees.
- Using the network analysis, in which departments would you recommend the HR team focus to boost collaboration?.
Loading packages & Transformation (Pandas)
Starting with importing necessary libraries Pandas , Numpay , Matplotlib , Seaborn , and , Plotly.
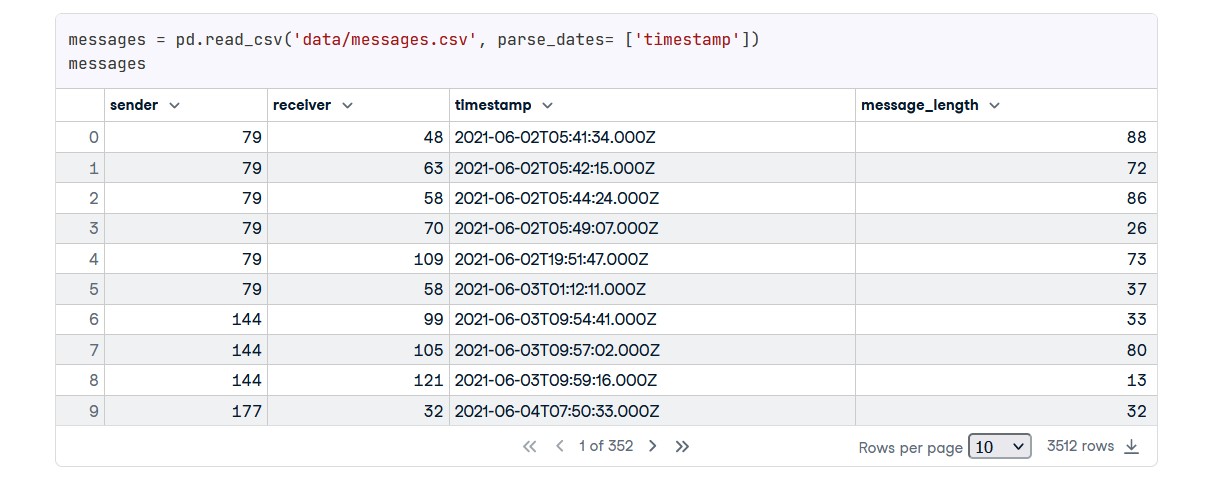
Reading datasets and take the first look and checking for messing and dublicated data and explore data types and EDA .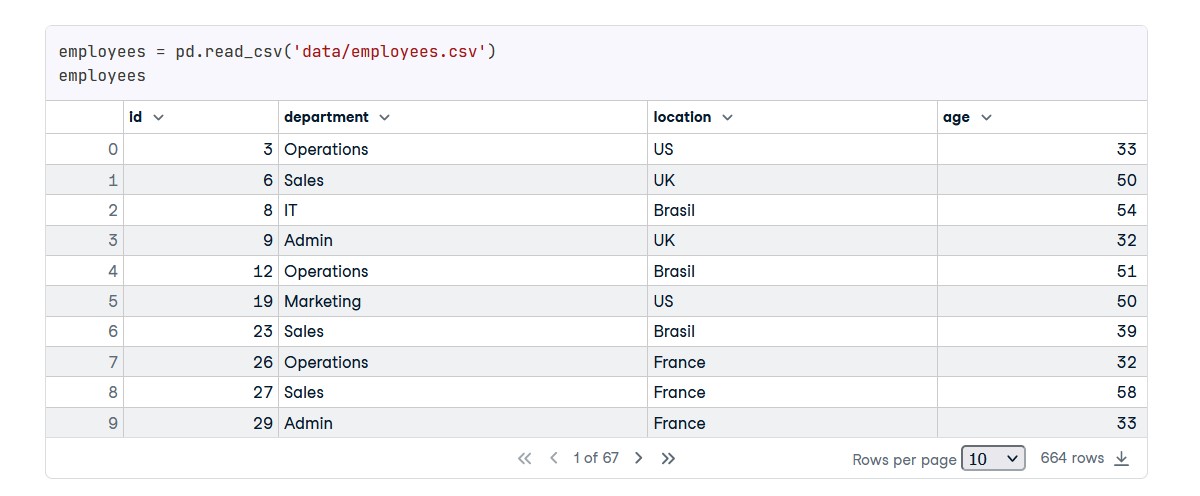

ASKING QUESTIONS
Below is a screenshot of the data model after cleansed and prepared tables were read into Power BI.
- We have (664) employees in our beautiful company ?
- Who is sending and did not receive response or interaction ?
- Who is sender and receiver ?
- Who is just receiver and don't make interaction with others (muted people)?
- Is there any employee not sender and not receiver ? i think this would be the worst case for any employee
EXPLORING THE STORY
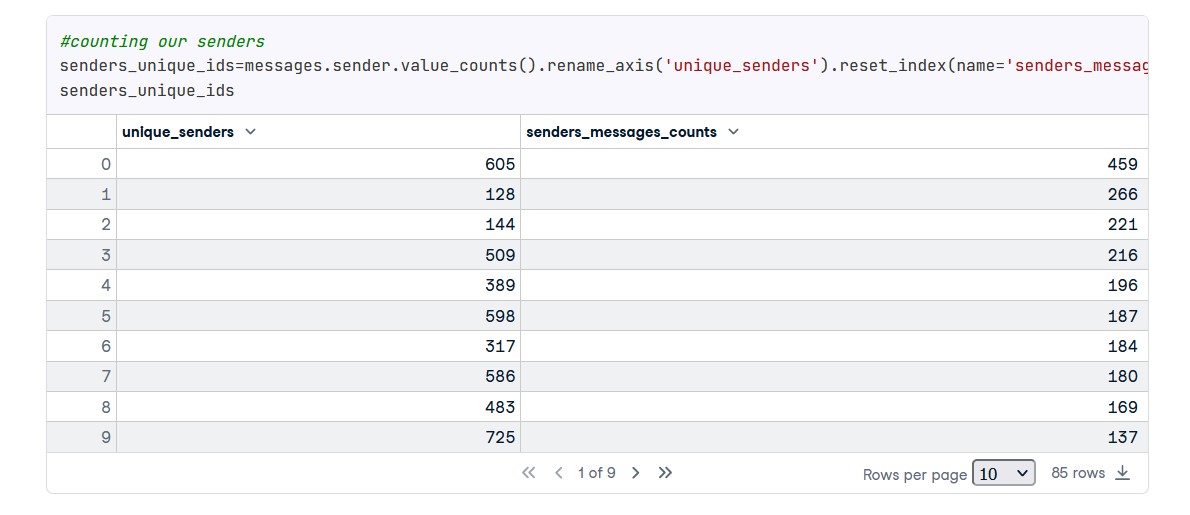
so let's go deeper and make our employees slices 🔪 , i think we can slice into 5 groups, all senders generally , most senders , only senders , senders and receivers and finally only receivers
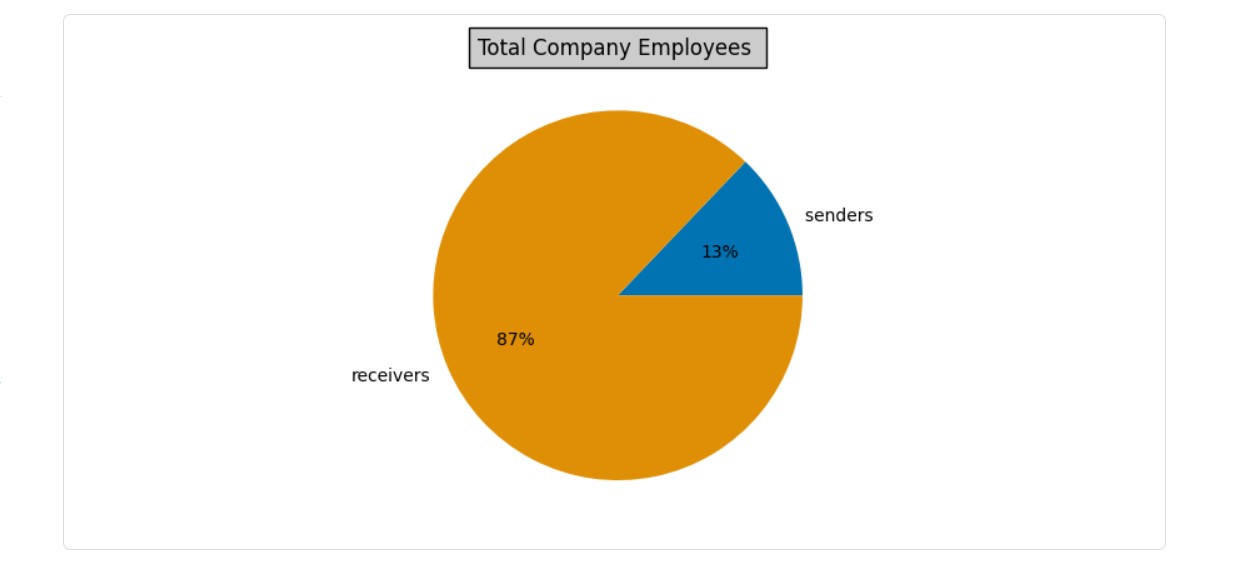
So we have only 85 employee trying to have communication with others , lees than 13 % from our people sending messages and it's a bad indicator
Here we just put our hands on the biggest , main and general problem witch is the most of our employees don't interact with others , so we will focus in it and we will ignore making date and time analysis because we have a general problem not a periodic problem

Now let's see employees whose have the most impact , according to to the role 20/80 , I think that just 20% of senders employees making 80% of total impact so let's explore
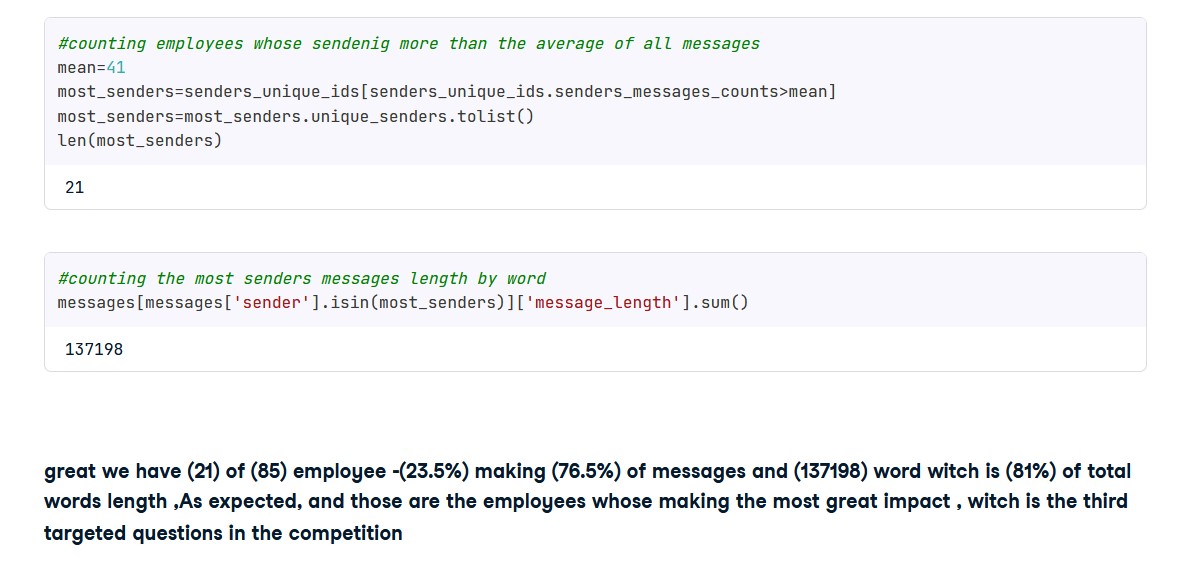
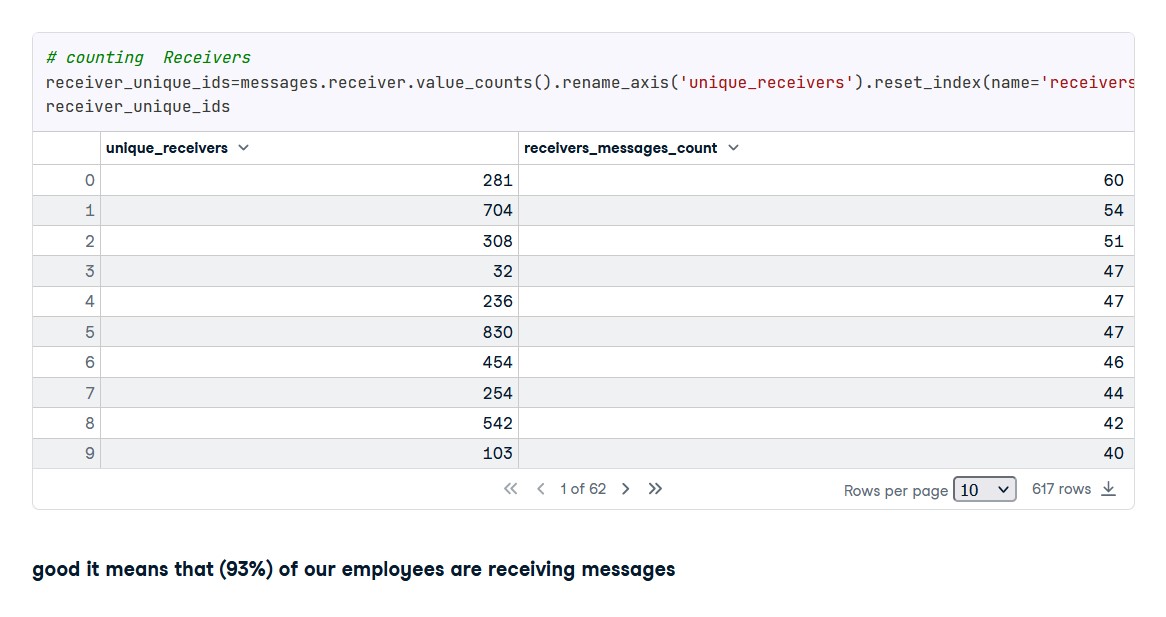
Now let's go deeper in our data
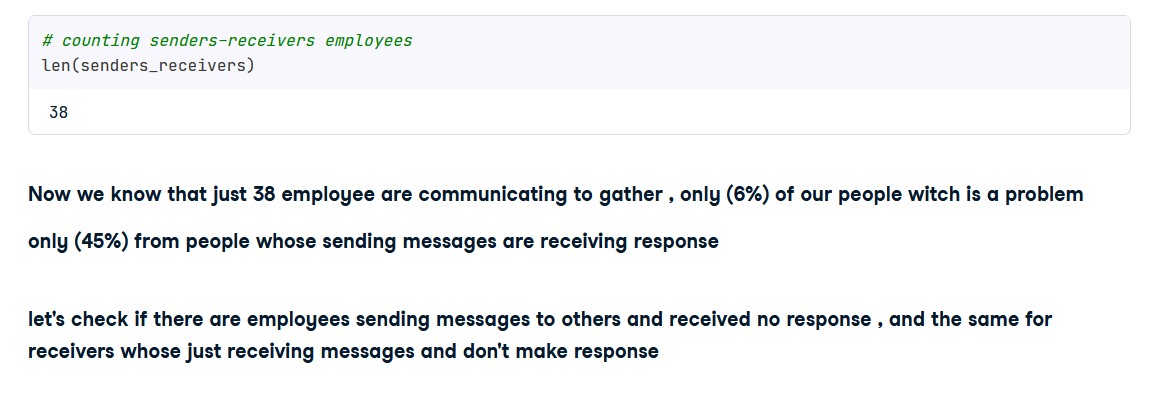

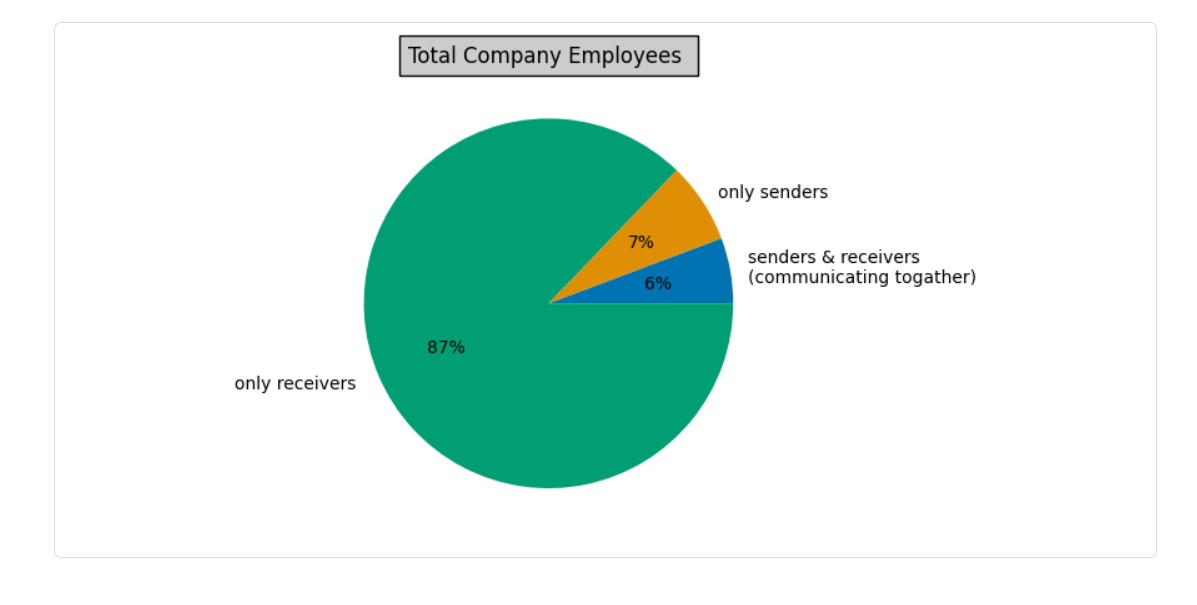
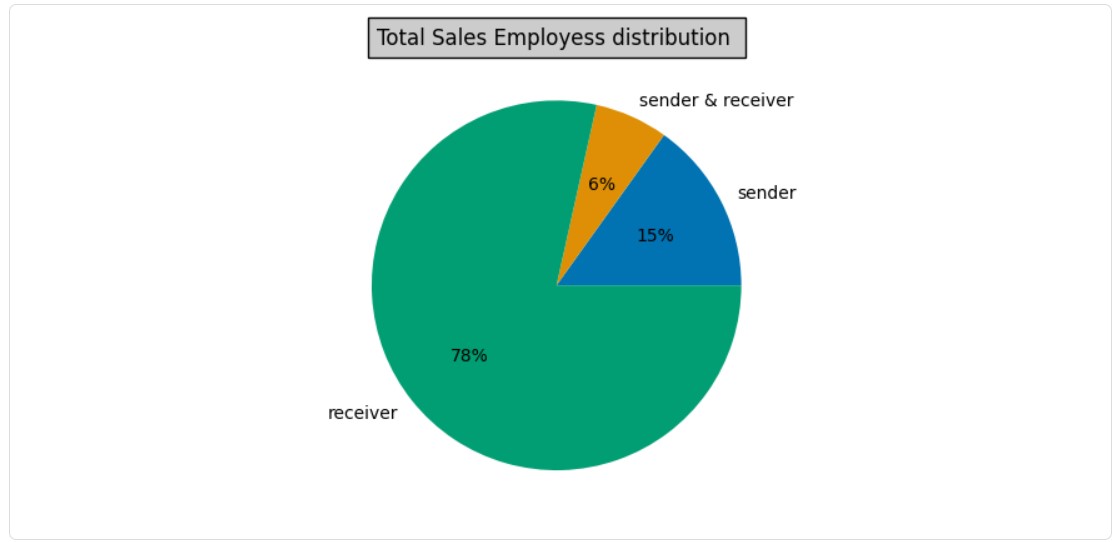
Now our data told us that (55%) of people whose sending messages didn't receive response witch is a big ratio And only (6%) of people whose receiving messages responds to these messages and (94%) didn't make a response

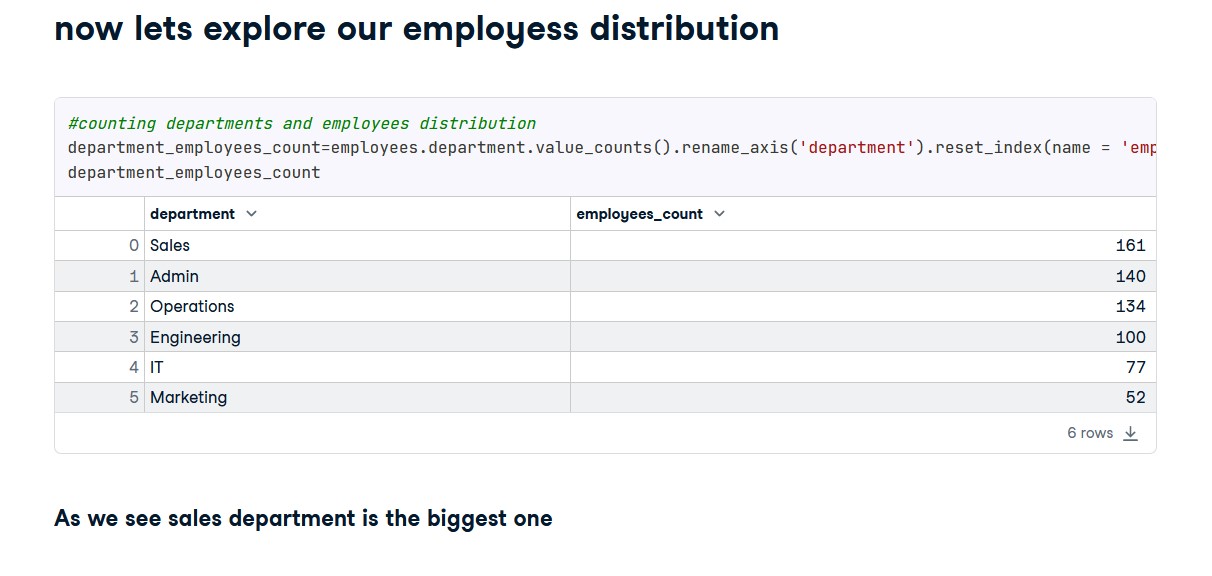

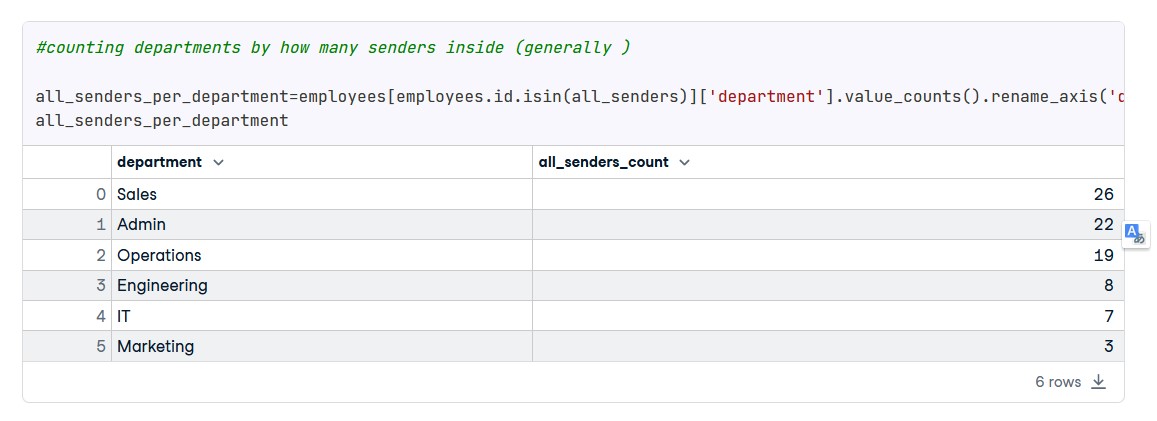

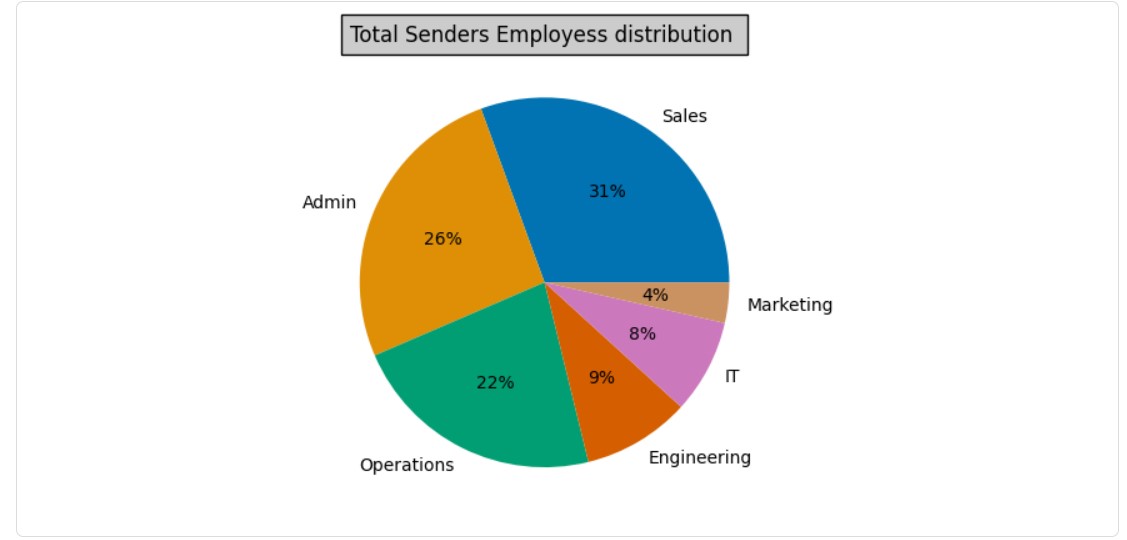
Only by eye we can see clearly that Salse is the most active and the most influential department , because it have more than (30%) of all senders in generally And (47%) of the most senders employees specifically
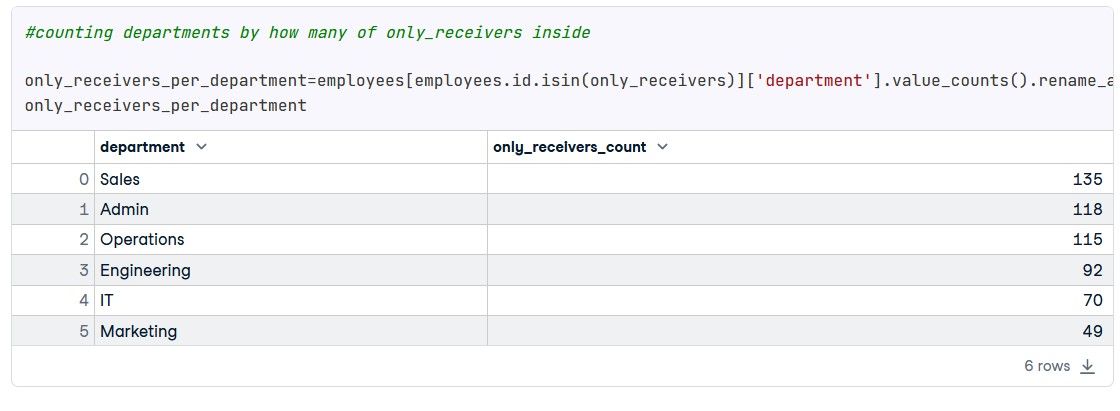
So now clearly we can see that only_receivers employees are our target, let's describe them correctly and call them muted employees
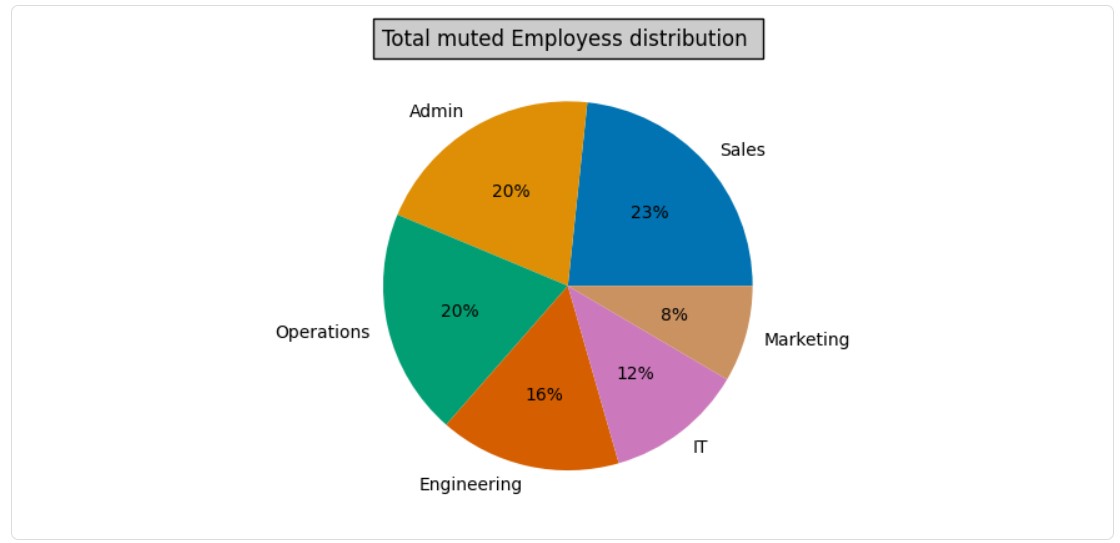

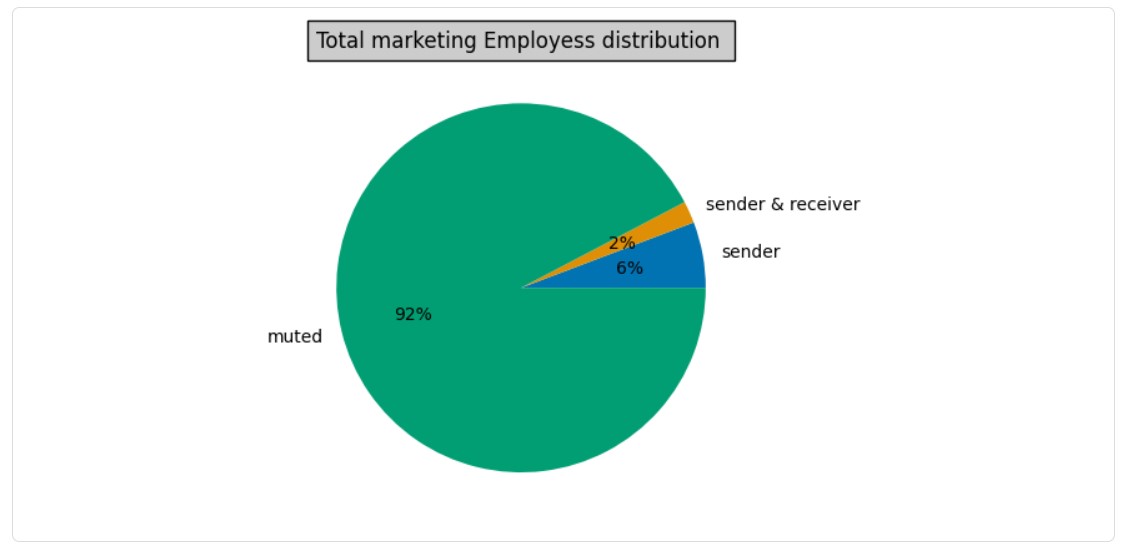
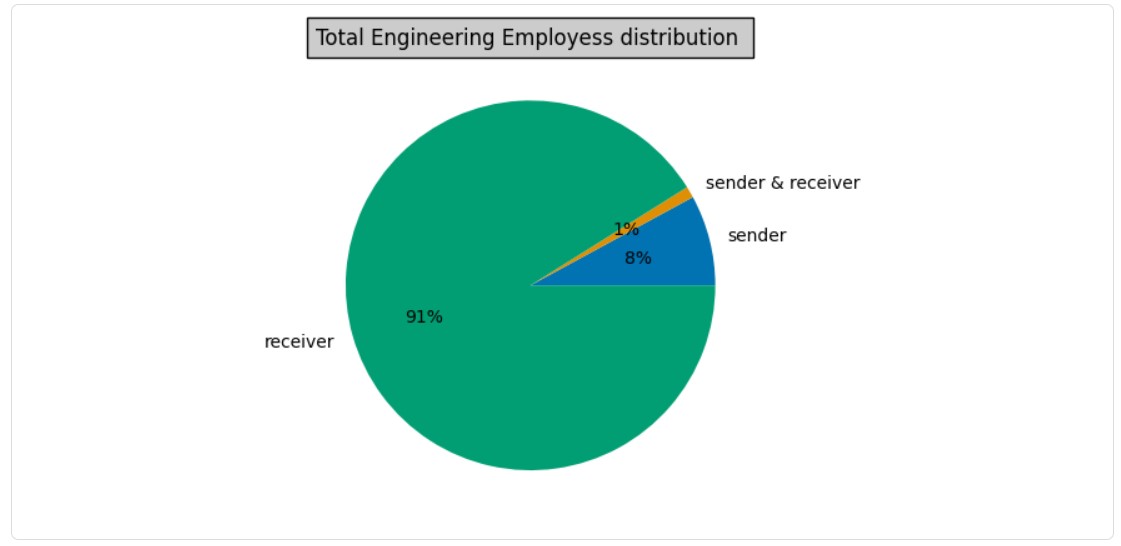
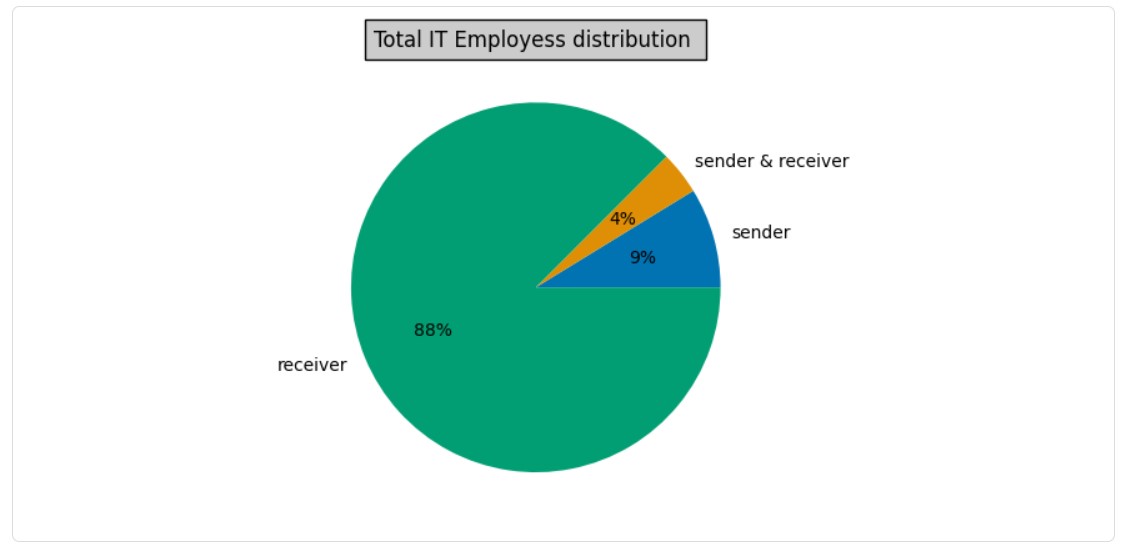
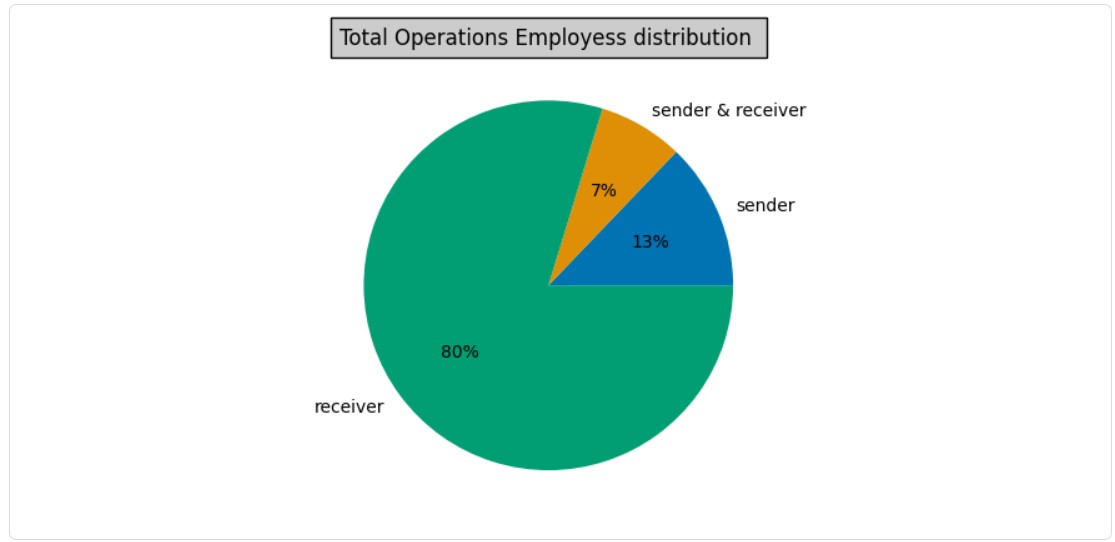
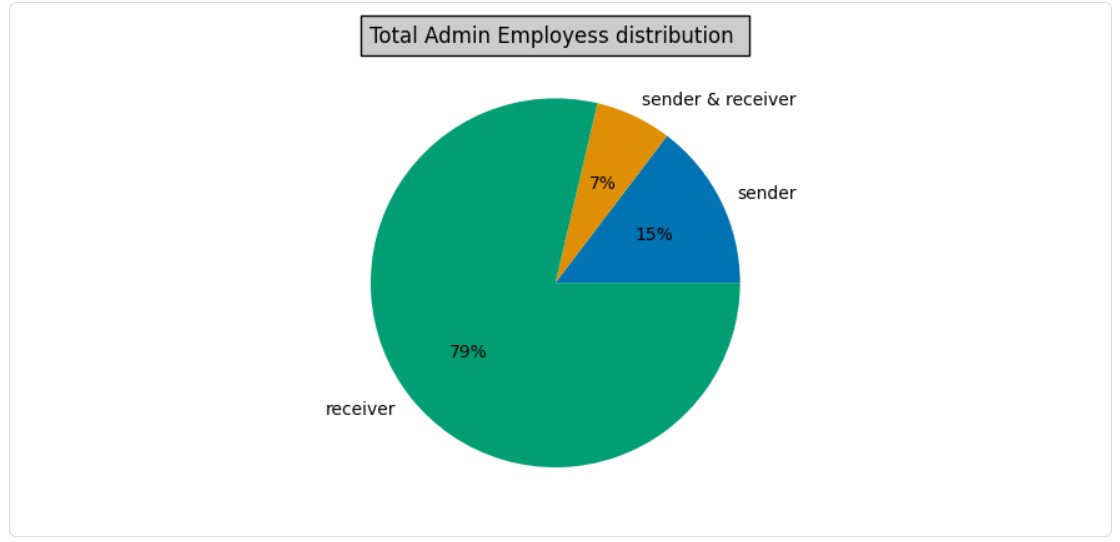
So Marketing department is the least active with only less than (5%) of the department employees sending messages
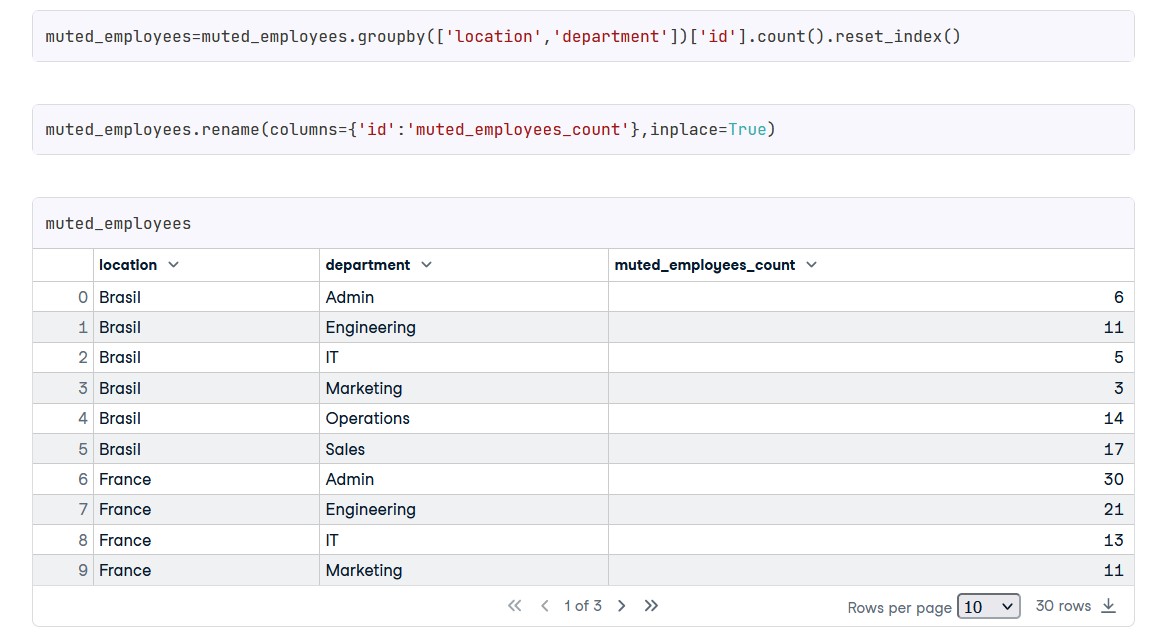
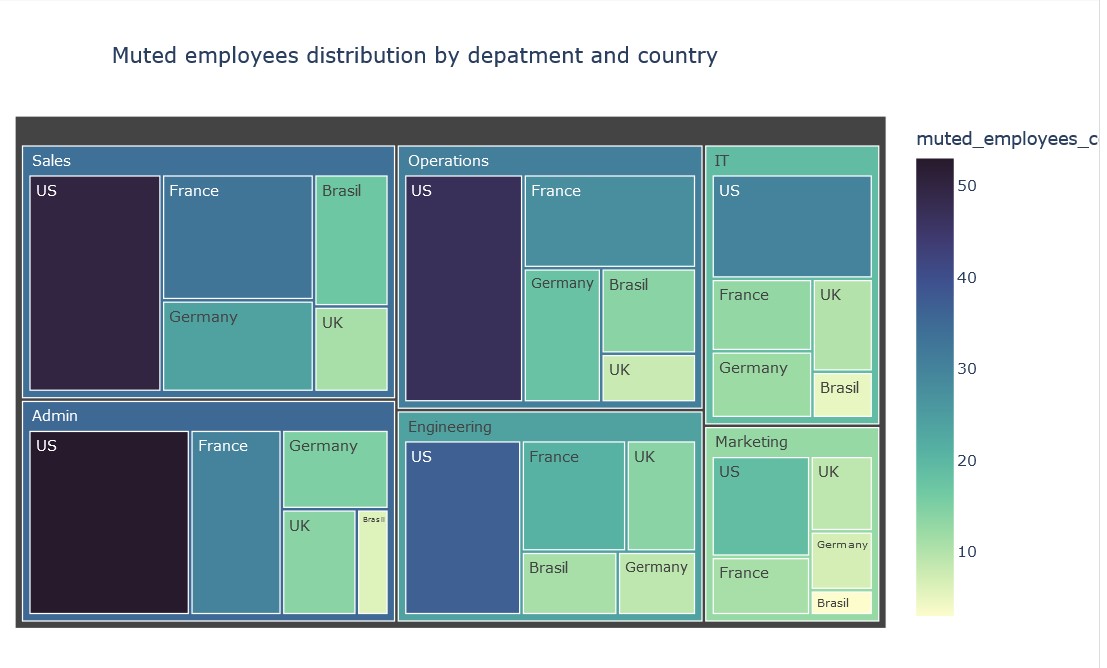
let's see how the geographical distribution impact on our target
